2. Sample quality control
[1]:
from pylluminator.samples import Samples
from pylluminator.utils import set_logger
from pylluminator.annotations import Channel
from pylluminator.quality_control import *

import matplotlib.pyplot as plt
import pandas as pd

set_logger('WARNING')  # set the verbosity level, can be DEBUG, INFO, WARNING, ERROR
2.1. Load pylluminator Samples
We assume that you have already processed the .idat files according to your preferences and saved them. If not, please refer to notebook 1 - Read data and get beta values before going any further.
[2]:
my_samples = Samples.load('preprocessed_samples')
my_samples
[2]:
Samples object with 6 samples: LNCAP_500_1, PREC_500_1, PREC_500_3, LNCAP_500_3, LNCAP_500_2, PREC_500_2
updated annotation - EPICv2 array - genome version hg38
937,688 probes
2.2. Chose a sample and print QCs
[3]:
sample_name = 'LNCAP_500_3'
detection_stats(my_samples, sample_name)
intensity_stats(my_samples, sample_name)
nb_probes_stats(my_samples, sample_name)
type1_color_channels_stats(my_samples, sample_name)
dye_bias_stats(my_samples, sample_name)
betas_stats(my_samples, sample_name)
===================================================================
|  Detection - mask not applied
===================================================================

N. Probes w/ Missing Raw Intensity                      2
% Probes w/ Missing Raw Intensity                       0.00 %
N. Probes w/ Detection Success                          868,918
% Detection Success                                     92.67 %

N. cg probes                                            933,252
N. Probes w/ Detection Success cg                       865,540
% Detection Success cg                                  92.74 %

N. ch probes                                            2,914
N. Probes w/ Detection Success ch                       2,554
% Detection Success ch                                  87.65 %

N. snp probes                                           65
N. Probes w/ Detection Success snp                      65
% Detection Success snp                                 100.00 %

===================================================================
|  Signal intensity - mask not applied
===================================================================

Mean in-band signal intensity                           2492.96
Mean in-band signal intensity (M+U)                     4982.73
Mean in-band type II signal intensity                   2368.62
Mean in-band type I Red signal intensity                3291.55
Mean in-band type I Green signal intensity              3252.46
Mean out-of-band type I Red signal intensity            225.18
Mean out-of-band type I Green signal intensity          253.84
Number of NAs in Methylated signal                      4,610
Number of NAs in Unmethylated signal                    4,600
Number of NAs in Type 1 Red signal                      1,506
Number of NAs in Type 1 Green signal                    924
Number of NAs in Type 2 signal                          6,780
-- note : these NA values don't count probes that don't appear in .idat files; these are only counted in the `Detection - missing raw intensity` QC line

===================================================================
|  Number of probes - mask not applied
===================================================================

Total :                                                 937,688
Type II :                                               809,393
Type I Green :                                          45,099
Type I Red :                                            83,196
CG :                                                    933,252
CH :                                                    2,914
SNP :                                                   65

===================================================================
|  LNCAP_500_3 Type I color channel - mask not applied
===================================================================

Green to Green :                                        45,080
Green to Red :                                          19
Red to Red :                                            82,706
Red to Green :                                          490

===================================================================
|  Dye bias - mask not applied
===================================================================

Median Inf type I red channel intensity                 6538.87
Median Inf type I green channel intensity               6442.33
Median of top 20 Inf type I red channel intensity       29926.23
Median of top 20 Inf type I green channel intensity     22176.17
Ratio of Red-to-green median intensities                1.01
Ratio of top vs global Red-to-green median intensities  1.33

===================================================================
|  Betas - mask not applied
===================================================================

Mean                                                    0.53
Median                                                  0.62
Unmethylated fraction (beta values < 0.3)               36.80 %
Methylated fraction (beta values > 0.7)                 45.89 %
Number of NAs                                           103,061
Fraction of NAs                                         10.99 %
------ cg probes ------
Mean                                                    0.54
Median                                                  0.62
Unmethylated fraction (beta values < 0.3)               36.58 %
Methylated fraction (beta values > 0.7)                 46.05 %
Number of NAs                                           101,837
Fraction of NAs                                         10.91 %
------ ch probes ------
Mean                                                    0.04
Median                                                  0.03
Unmethylated fraction (beta values < 0.3)               99.87 %
Methylated fraction (beta values > 0.7)                 0.00 %
Number of NAs                                           524
Fraction of NAs                                         17.98 %
------ snp probes ------
Mean                                                    0.48
Median                                                  0.50
Unmethylated fraction (beta values < 0.3)               36.92 %
Methylated fraction (beta values > 0.7)                 32.31 %
Number of NAs                                           0
Fraction of NAs                                         0.00 %
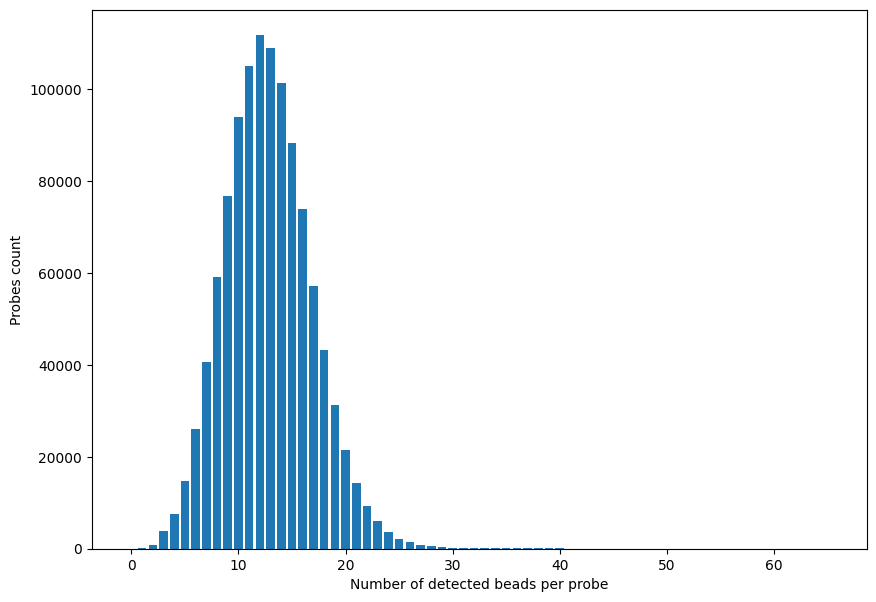
2.3. Plot the number of beads per probe
This will work only if you have kept the .idat data when reading the samples (parameter keep_idat=True)
[4]:
count_beads = my_samples.idata[sample_name][Channel.RED].groupby('n_beads').count()

# don't display the (very) long tail of the graph, stop at the last bin that contains at least 5 probes
five_probes_min = count_beads[count_beads.mean_value > 5]
max_more_than_five_probe = five_probes_min.index.max()

# plot
plt.figure(figsize=(10, 7))
plt.bar(five_probes_min.index, five_probes_min['std_dev'])
plt.xlabel('Number of detected beads per probe')
_ = plt.ylabel('Probes count')