4. Copy Number Variation
[1]:
from pylluminator.samples import Samples
from pylluminator.cnv import copy_number_variation, copy_number_segmentation
from pylluminator.utils import load_object, save_object, set_logger
from pylluminator.visualizations import manhattan_plot_cns

set_logger('WARNING')  # set the verbosity level, can be DEBUG, INFO, WARNING, ERROR
4.1. Load pylluminator Samples
We assume that you have already processed the .idat files according to your preferences and saved them. If not, please refer to notebook 1 - Read data and get beta values before going any further.
[2]:
my_samples = Samples.load('preprocessed_samples')
my_samples
[2]:
Samples object with 6 samples: LNCAP_500_3, PREC_500_3, LNCAP_500_1, LNCAP_500_2, PREC_500_2, PREC_500_1
EPICv2 array - genome version hg38
937,688 probes
[3]:
sample_sheet = my_samples.sample_sheet
sample_sheet
[3]:
| sample_id | sample_name | sample_type | |
|---|---|---|---|
| 0 | GSM7698462 | LNCAP_500_3 | LNCAP |
| 1 | GSM7698443 | PREC_500_2 | PREC |
| 2 | GSM7698435 | PREC_500_1 | PREC |
| 3 | GSM7698446 | LNCAP_500_2 | LNCAP |
| 4 | GSM7698459 | PREC_500_3 | PREC |
| 5 | GSM7698438 | LNCAP_500_1 | LNCAP |
4.2. Get CNVs for a sample group
Using the PrEC samples as normalizations samples, we can calculate the Copy Number Variation per probe for LNCaP samples, and group the bins in segments depending on their copy number.
[4]:
cnv_df = copy_number_variation(my_samples, group_by='sample_type', normalization_labels='PREC')

ranges, signal_bins_df, segments_df = copy_number_segmentation(my_samples, cnv_df, 'LNCAP')
WARNING:py.warnings:/home/docs/checkouts/readthedocs.org/user_builds/pylluminator/envs/v0.2/lib/python3.12/site-packages/pyranges/core/pyranges_groupby.py:61: FutureWarning: DataFrameGroupBy.apply operated on the grouping columns. This behavior is deprecated, and in a future version of pandas the grouping columns will be excluded from the operation. Either pass `include_groups=False` to exclude the groupings or explicitly select the grouping columns after groupby to silence this warning.
  return self.pandas_groupby.apply(*args, **kwargs)
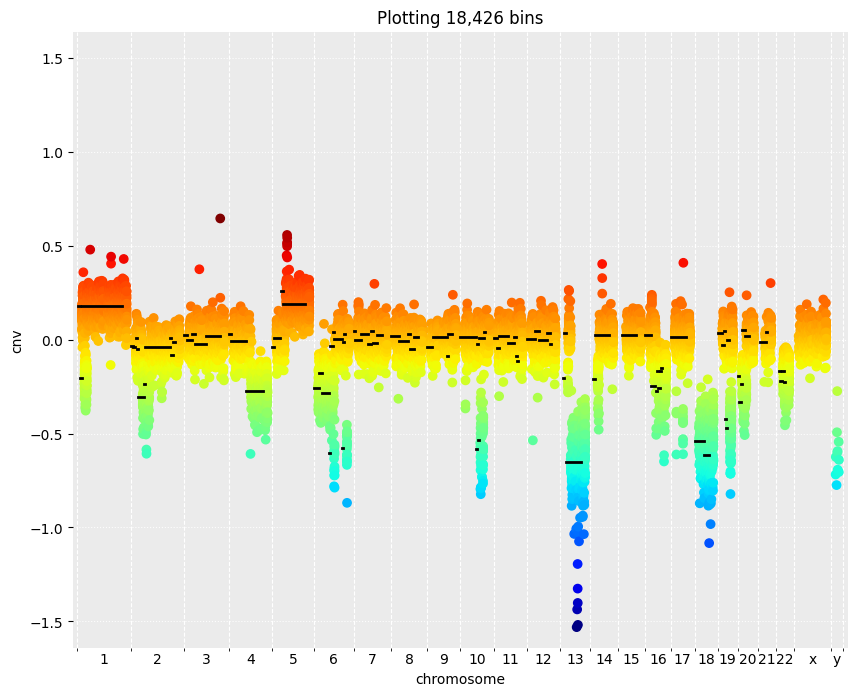
4.3. Visualize CNVs and segments
Plot the identified segments and CNV values
[5]:
manhattan_plot_cns(signal_bins_df, segments_df)